
Napalm, Toothaches, and Volatility: The Essential Guide to Surviving Bear Markets
By Matthew Lloyd (Director of Operations)
Reviewed and approved by James McKnight (Founder & CEO, Registered Portfolio Manager) — “The Prophet of Profit”

“A singular disadvantage of the sea lies in the fact that after successfully surmounting one wave you discover that there is another behind it just as important and just as nervously anxious to do something effective in the way of swamping boats.”
—Stephen Crane, The Open Boat
“For there was never yet philosopher
That could endure the toothache patiently.”
— Shakespeare, Much Ado About Nothing
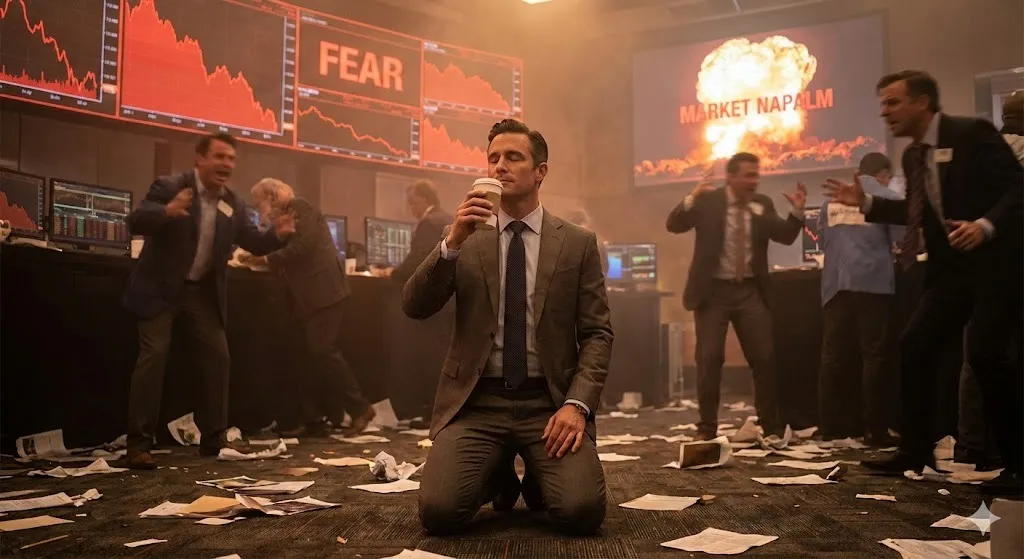
The Smell of Fear in the Morning: Surviving Bear Markets and Recessions
There’s a moment in Apocalypse Now when Lieutenant Colonel Kilgore kneels in the smoldering haze, serenely admiring the chaos around him. “I love the smell of napalm in the morning.”
It’s absurd, theatrical, and unsettling—which is exactly why the scene works. He’s calm in a moment no sane person would describe as calm.
Markets have their own version of napalm wafting through the air: fear. And whether you’re in Vancouver, or anywhere else markets occasionally misbehave, it has the same unmistakable scent.
Fear is an old companion in finance. It’s the metallic taste in your mouth when headlines turn sour, the cramp in your guts when the chart tilts lower, the whisper that says maybe this time won’t be okay. Bear markets and recessions trigger something primal in all of us. Even experienced investors feel it. It’s human.
But surviving bear markets isn't about escaping fear—it's about understanding it. As portfolio managers serious about long-term discipline, our job is to see it for what it really is: a recurring character, not the final scene.
The Vocabulary of Volatility: Defining the Downturn
Before we can talk about fear, we need a working vocabulary.
A bear market is simple: when markets fall 20% or more from a recent high. It’s a sharp downdraft in asset prices, usually fast, usually emotional, and often over before investors psychologically recover.
A recession is different. It is a contraction of the real economy—a tangible shrinking of the world in which we earn and spend. It is measured not in points lost, but in jobs shed, factories idled, and wallets closed. While a bear market is a crisis of price, a recession is a crisis of activity—a fundamental slowing of commerce. They often move in sync, but not in lockstep; a market can panic without a recession, just as an economy can contract without a crash.
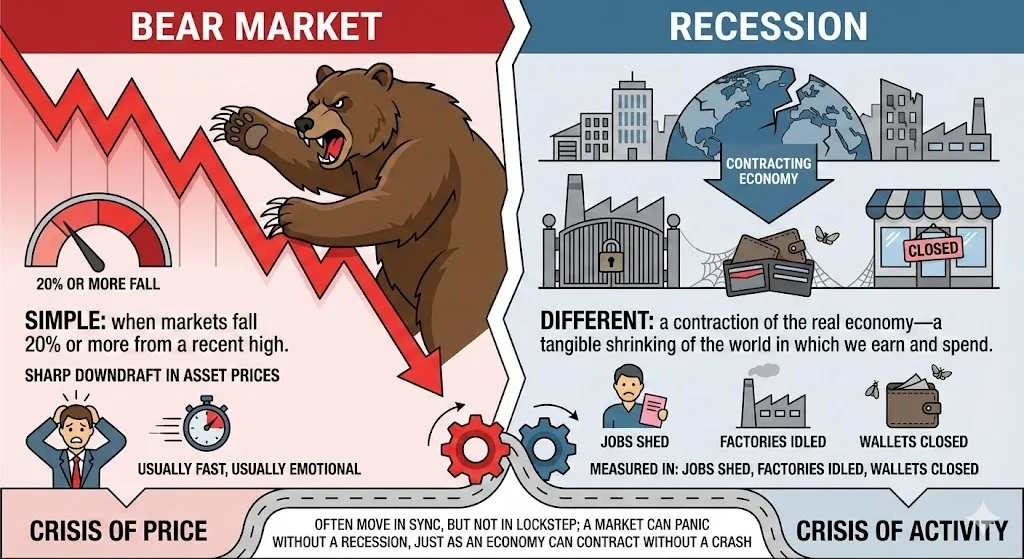
They’re related but not identical. Cousins, not twins.
And crucially:
- Most recessions are not catastrophic.
- Bear markets happen more often than recessions.
- And both are far more survivable than they feel at the moment.
Bear Markets Are the Price of Admission (Stop Trying to Sneak in for Free)
Here’s a statistic that feels like an insult: the longer you invest, the more bear markets you will endure. Not might—will.
If you invest for 15 years, history gives you a 100% chance of experiencing a 20% drop. This isn’t a bug in the system; it is the system. Markets rise over time, but not in straight lines. Volatility is the toll we pay for long-term growth.
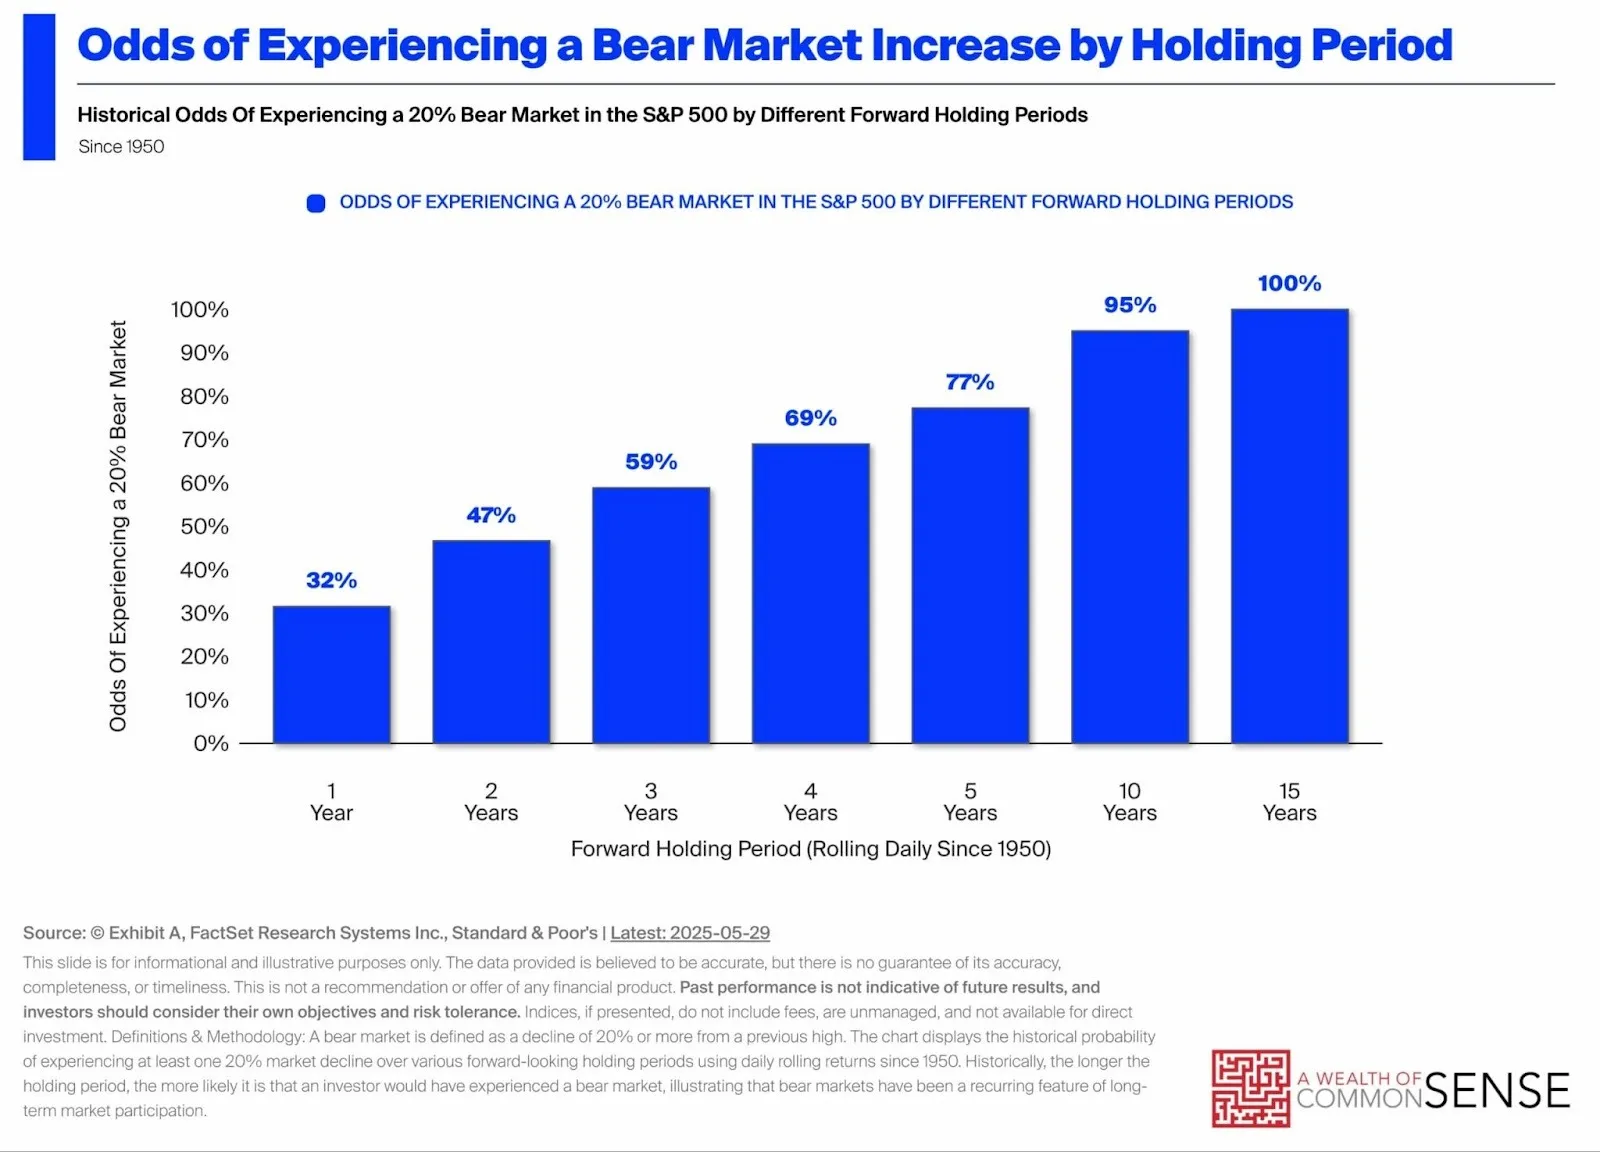
Source: A Wealth of Common Sense
The danger isn’t the bear market itself. The danger is treating a normal market event as an abnormal catastrophe. That’s when investors panic, sell low, and commit financial self-harm—lacking sound investment advice when it matters most.
Running from a bear is often the worst thing you can do. Markets aren’t much different.
The Asymmetry of Wealth: Short Storms, Long Summers, Massive Compounding
When you zoom out, something striking emerges: bear markets are brief, violent intermissions. Bull markets are the show.
- The average bear market lasts 11.1 months, falling 31.7%.
- The average bull market runs 4.3 years, rising 149.5%.1
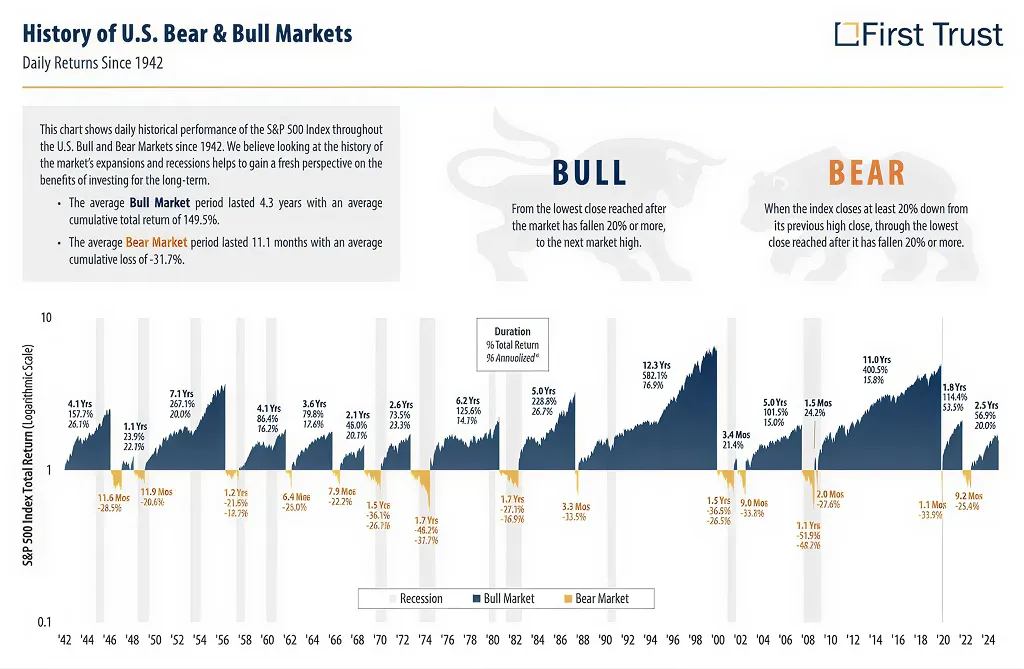
Source: First Trust
The asymmetry is stark—like comparing a thunderstorm to a summer. One is loud and disruptive; the other defines the season.
This is why fear distorts our sense of reality. We obsess over the short storms and forget the long summers.
1The data reflects the S&P 500 Index Total Return from 1942 to 2024. We encourage you to look at the arc, not the arithmetic—the broad direction matters more than the decimal points.
Your Brain Was Built for the Savanna, Not the S&P 500
Even within bull markets, investors tend to underestimate their endurance. Some bull runs have lasted 100 months or more. The short ones stand out precisely because they’re unusual.
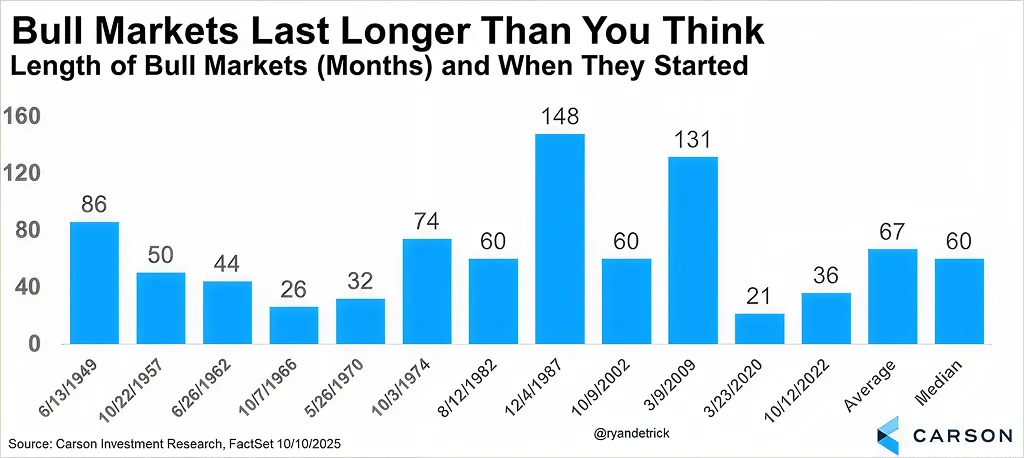
Source: Carson Group
Our brains evolved to fixate on threats. That negativity bias was great for dodging lions on the savanna, but it tends to keep modern investors poor. The market rarely rewards the pessimist who assumes the party ends tomorrow. It rewards the investor who stays put, tunes out the noise, and lets compounding do the heavy lifting.
The Other Side of Fear: Patience As An Asset Class
Fear screams in the short term, but it whispers over time.
One-year returns are manic. Three-year returns calm down. Five-year returns are overwhelmingly positive. And the long-term record is stark: over the last 82 years (1942-2024), the S&P 500 has never delivered a negative total return over a 10-year period:
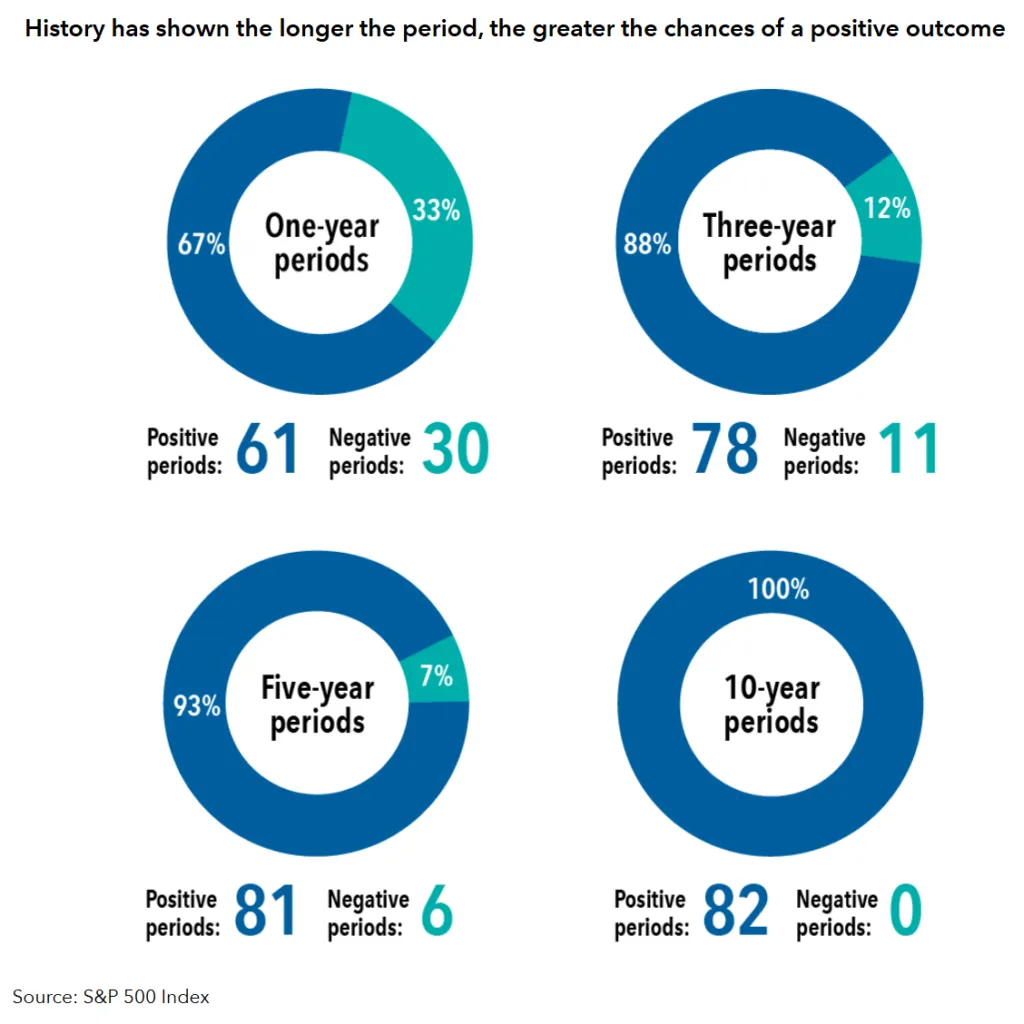
Source: Capital Group
The future owes the past nothing. It will be different. But the historical record reveals a persistent truth: time dilutes risk.
In the moment, a 20% drop looks like a cliff edge. On a thirty-year chart, it’s a speedbump on the road to wealth. Yes, you will live through bear markets. But history suggests you will also recover from them—and then some.
The Economy Is Harder to Break Than You Think
The US has experienced 34 recessions since 1855. But don't just count them—look at the timeline.
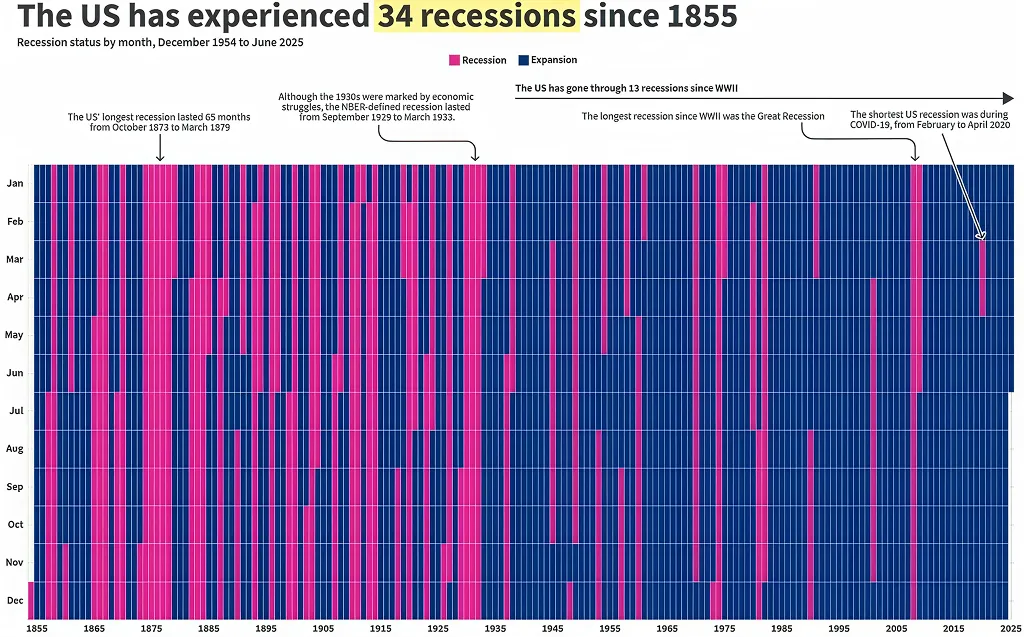
Source: Chart by USAFacts, via Voronoi App
The left side of the chart looks like a crime scene—a sea of pink recessions. The right side? It’s a wall of blue expansion.
From Fragile to Formidable: Why Recessions Are Changing
Why the shift from fragile to formidable? The honest answer is that no one knows for sure.
Economists love to argue the cause. Some point to the stability of the service sector; others credit better policy tools, global diversification, or technological innovation. It’s likely a messy cocktail of all the above (and then some).
We’ll leave the "why" to the academics. What matters to us is the "what." The economy has become harder to break. Betting on the pink bars is a great way to sound smart at a cocktail party—and an awful approach to wealth management.
Slaughtering Fatted Calves Won’t Save Your Returns. Earnings Will.
It’s one thing to say markets bounce back. It’s another to understand why.
Markets don’t recover because investors slaughter fatted calves on the corner of 5th and Wall to appease the volatility gods. They recover for a much more boring reason: math.
Underlying businesses continue to produce cash flows. Economies expand. Innovation compounds. Productivity improves. Markets aren’t powered by vibes or rituals—they’re powered by profits.
And profits have a stubborn habit of rising over time.1
1We’re looking at the long-term trend line. And while history often rhymes, it never repeats exactly—past performance is no guarantee of future results.
From Heavy Lifters to High Flyers: A History of Margins
Here’s a stat that we rarely hear amidst the usual diet of doom and gloom: companies today are structurally more profitable than their predecessors.
Since the 1990s, profit margins have essentially doubled—rising from the mid-single digits to 10–11% today.
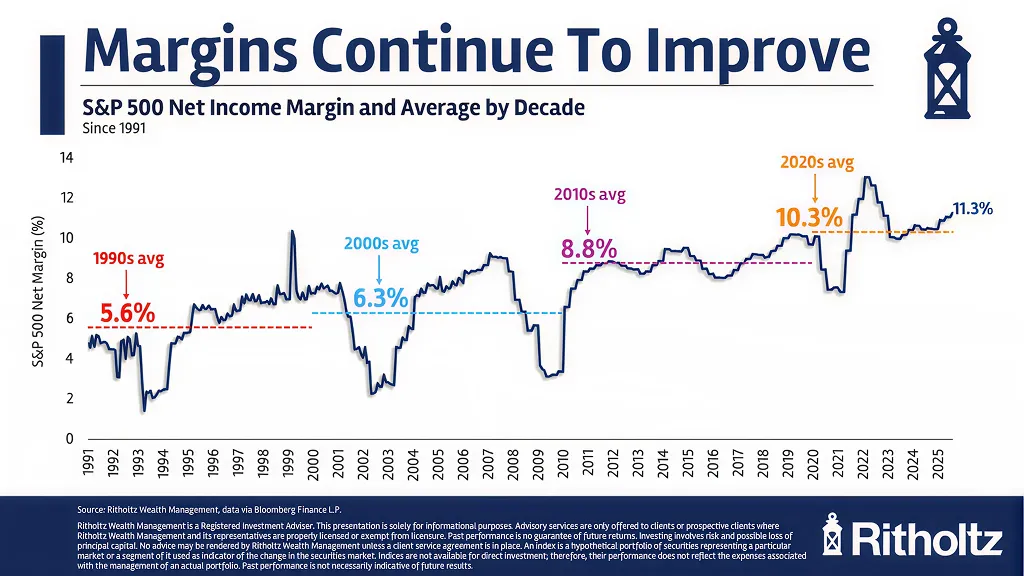
Source: Ritholz Wealth Management
The Unbearable Lightness of Profit
We can't point to a single smoking gun, but we can look at the suspects.
The modern S&P 500 looks little like its grandfather. It has swapped smokestacks for servers and inventory for intellectual property. Today's giants are benefiting from a potent blend of digitization, global scale, and capital efficiency.
Whatever the exact blend of causes, the result is undeniable: businesses today are keeping more of every dollar they earn. Higher, more durable margins help explain why recoveries increasingly reach new highs. The modern balance sheet is lighter, but the profits are significantly heavier.
Valuation vs. Profitability: The Market Isn’t as Expensive as It Looks
“Markets look expensive” is the comfort food of financial journalism. It’s safe to say and easy to swallow, but offers little nutritional value to a growing portfolio.
Why? Because valuations don't float in a vacuum. They sit on top of earnings, margins, and quality.
The Forward P/E ratio is the standard yardstick—how much are you paying for a dollar of future earnings? But here is where the headline writers often get it wrong: they assume all earnings are created equal.
They aren't.
The P/E Illusion: Why Margins Matter More Than Multiples
A dollar earned by a capital-heavy factory with 4% margins is grueling. A dollar earned by a scalable software giant with 25% margins is efficient.
Treating them as "equally expensive" just because they share the same P/E ratio makes as much sense as comparing a Honda and a Ferrari because they both have four wheels.
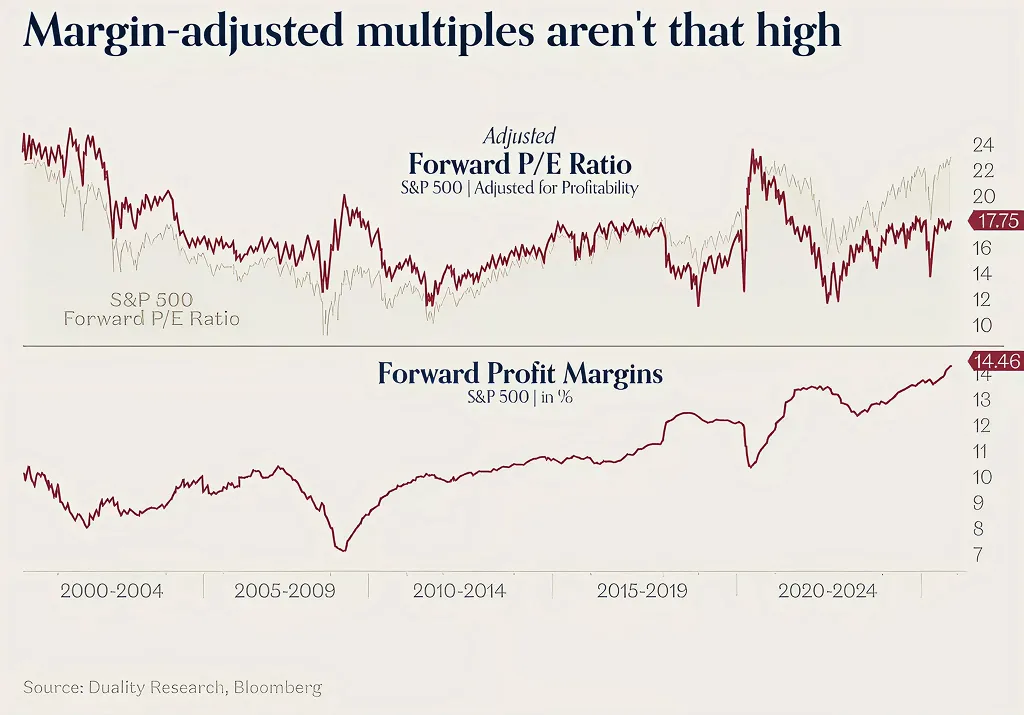
Source: Andreessen Horowitz (a16z)
The chart above tells the story of the modern economy.
- The Grey Line (Raw Valuation): Looks elevated. Scary.
- The Red Line (Margin-Adjusted): Tells a much calmer story.
In the early 2000s, margins were weak, making the market genuinely expensive. Today, the data indicates that higher stock prices are simply a reflection of businesses that have become far more efficient at making money.
Prices aren’t floating on air—they’re floating on earnings. And it appears those earnings are doing a better job of supporting prices than the headlines would have you believe.1
1Recessions are inevitable. Misfortune is guaranteed. And in the event of World War III, an asteroid strike, Skynet, etc, all bets are off. But unless the sky actually falls, the opportunity set looks extraordinary. We have never seen a more plentiful selection of high-quality businesses on offer.
Every Storm Runs Out of Water: Will You Still Be Invested?
Everyone fears a crash. Even pros. Even us. The difference isn't the fear; it's the reaction.
Amateurs panic and sell. Professionals observe and accumulate. That’s how you turn a crisis into capital. Surviving bear markets is the price of admission for profiting from them.
History tells us that bull markets are longer, recoveries are stronger, and the trend line is undefeated. The greatest threat to your wealth isn't a recession; it's the bad decisions you make during a recession.
Betting against the market is betting that human ingenuity, productivity, and ambition will suddenly stop. That is a terrible bet.
You don't build wealth by dodging raindrops; you build it by knowing that every storm eventually runs out of water.
If you want portfolio management built for the next thirty years, not the next thirty minutes, contact us at Wealth Preservation Management today. The path isn't straight, but our aim is true. We promise disciplined ambition in pursuit of your prosperity.